Developers spend more time and effort in finding and fixing bugs than they spend in writing code. Therefore, this is crucial for every programmer to master the art of finding bugs faster and effectively. By combining the effective debugging techniques explained in this article, you will be able to drastically reduce the time and effort required in finding and fixing bugs.
Though every popular IDE available today provides lot of built in features for easily debugging your code, we often overlook or do not effectively utilize those features. In this article, I will try to help you with my long experience of debugging as a java developer.
I will use popular Eclipse IDE for this article. However, the tools and techniques described here are mostly available in all popular IDEs.
Setting Correct Debug Points
Setting debug points is the stepping stone in debugging. If you intuitively know which part of your program is causing a bug, you can straight way go to that class and method and add a debug point there.
To be more specific, if you are getting a null pointer exception, you can find the line number from the stack trace itself and add a break point to check which attribute is null and trace back to find why that attribute is not populated.
If you are getting a checked exception due to some handled error condition in your application, you can guess the location of the problem from the type of the exception thrown.
For the purpose of this article I have created a simple application with three classes. Main class is MathematicalFunctions with a method calculateAverage(List<BigDecimal> inputs) to calculate the average of the values sent in input list. Using this method from the main() method, the class finds average salary of software developers based on skill set.
This is very simple application but will suffice to help us understanding the concepts of debugging. Instead of listing the complete code, I have used screen shots to explain the concepts. So lets get started.
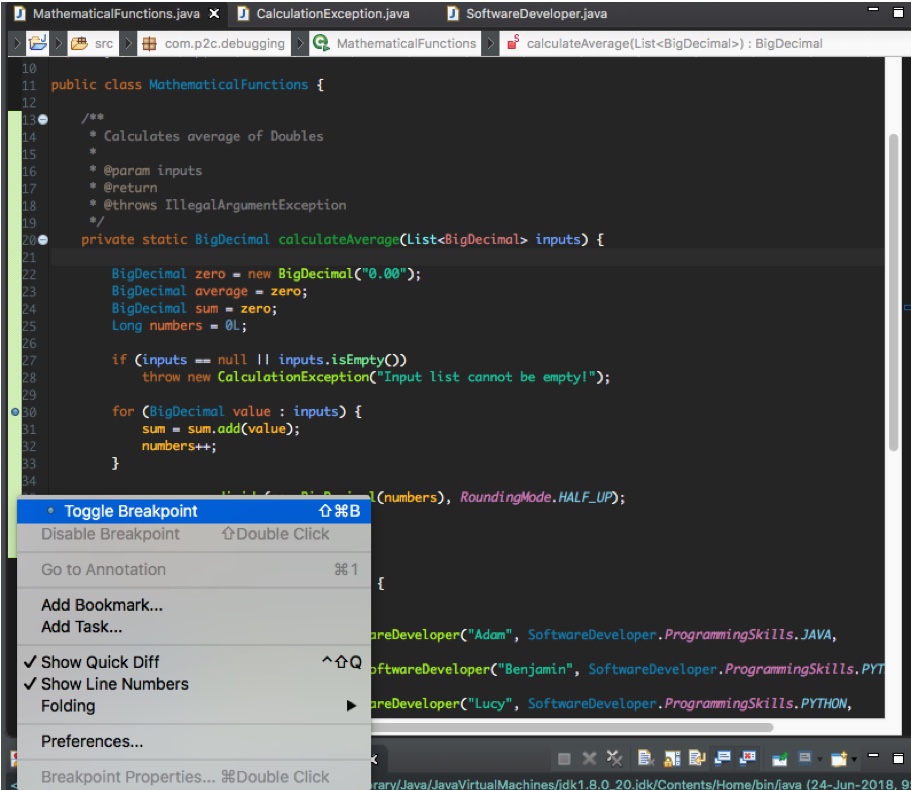
Adding a break point is as simple as double clicking on the side bar of the code editor or right clicking on the side bar and selecting ‘toggle breakpoint’ option.
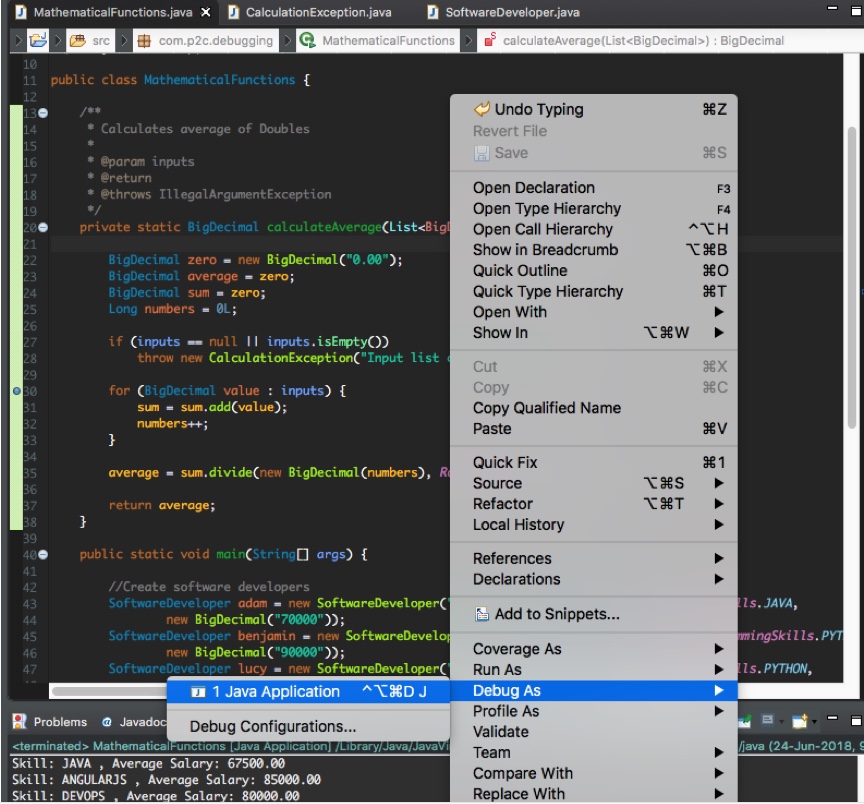
Once the debug point is set, you need to run the application in debug mode. To do that, right click anywhere in the main java class and select Debug As Java Application option. Please check the screen shot below.
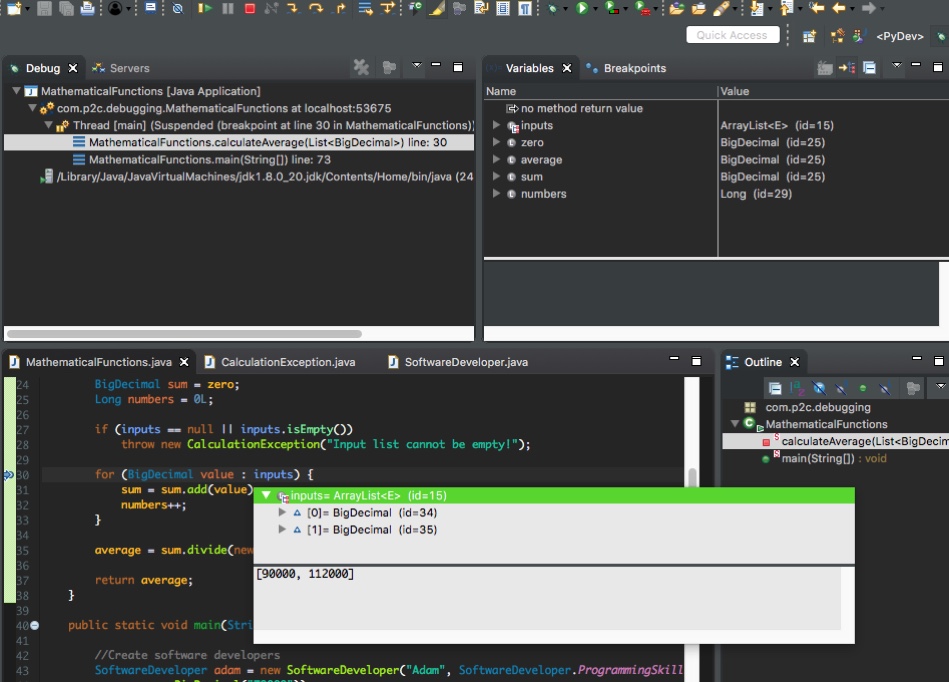
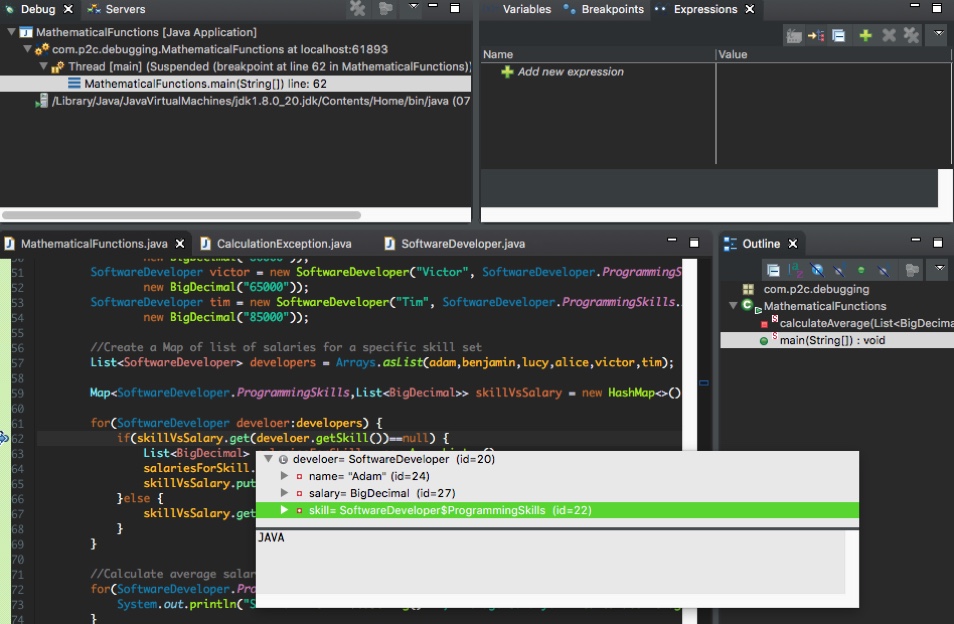
Debugger will automatically suspend execution at the specified breakpoint. You will be able to inspect the value of the variables by putting the cursor over any variable. Most of the time you will need to step forward by executing one statement at a time or directly go to the next break point in execution path or step into another method within same class or other class.
Every IDE has short cut keys for each function and you must remember the shortcut keys for your favorite IDE. For Eclipse, shortcut key for executing one step is F6, key to run to the next breakpoint is F8 and key for stepping into another method is F5.
Please check the debugger screen shot below with a window for inspecting values of any variable. For nested entities, you can click on the triangle beside a variable to drill down and check the value of nested attributes.
Judiciously Use ‘Inspect’ and ‘Watch’ Options
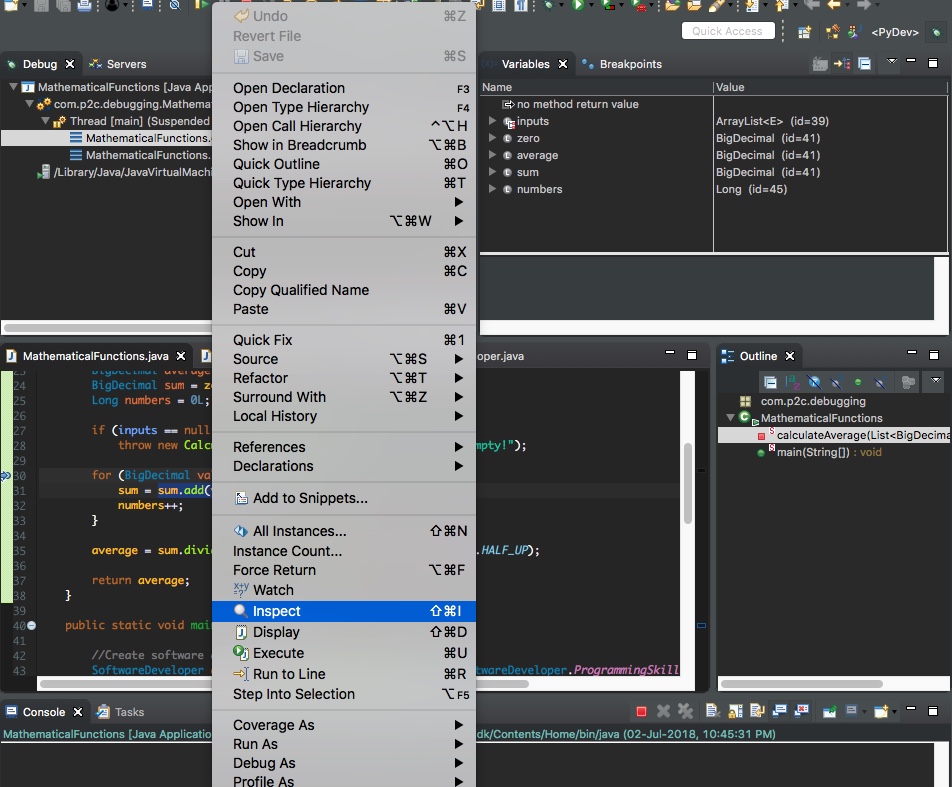
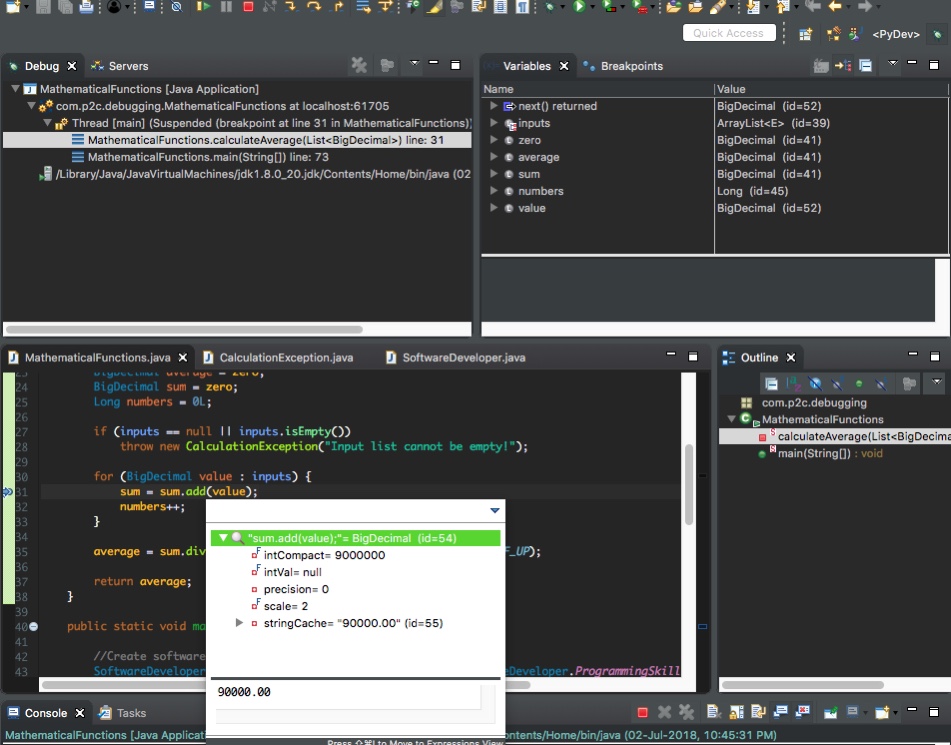
Sometimes we need to check the output of an expression before actually executing the step to compare the outputs. In these situations, we can use the inspect option. This feature allows us to evaluate any expression. Please check the screen shot below. Breakpoint is stuck at line 31. At this point if we want to check what would be the outcome of the expression without stepping to line 32, we have to do the following. We can simply select the expression sum.add(value), right click and choose ‘Inspect’ option.
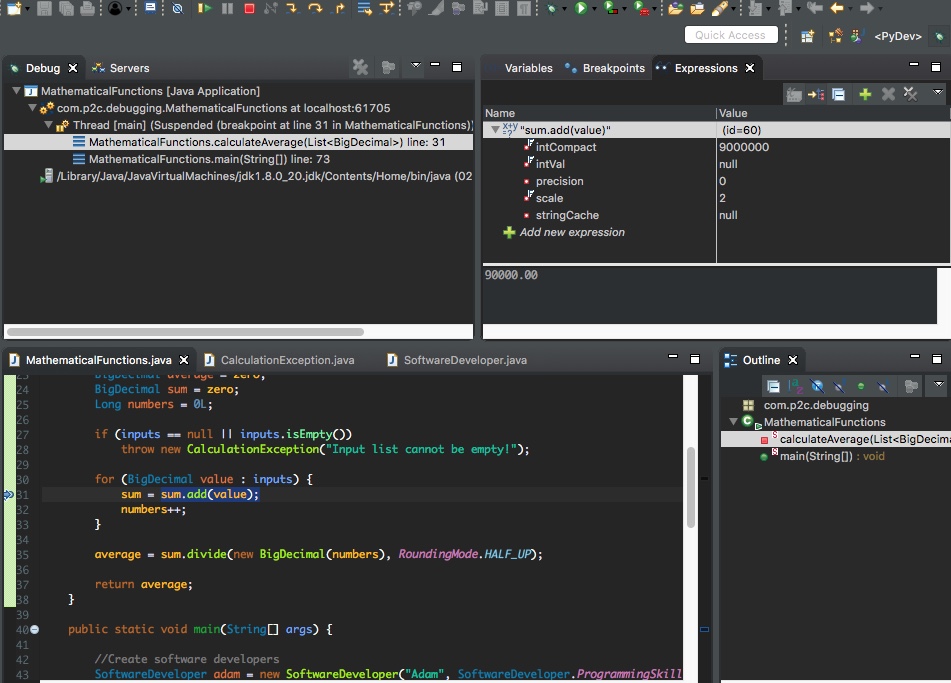
When we are looping through a list of elements and performing some evaluation for each iteration, it becomes frustrating to move the cursor to the output variable and inspect the result of each iteration. In such scenarios, watch expressions come handy. Please check the ‘Expressions’ pane in top right corner of the below screen shot. As we loop through the values of the list, outcome of the watch expression is automatically refreshed as per the changed variables of current iteration.
We can add multiple watch expressions as per our need. The expression can be any valid java expression using the variables in scope. It can be different from the expression written in the actual code.
Catch Exceptions Faster with Java Exception Break Points
You may say, I can see the line number in the stack trace from where the exception is thrown. Why do I need exception break points?
Consider the scenario where the line of code throwing the exception is within a for loop and the list size is 1000. Would you iterate through 1000 elements to check which one instance is the culprit? There must be a better way, right?
Exception breakpoints can save the day when your code is throwing an exception from within a loop. Java exception breakpoints suspend execution at the statement which will result in the specified exception you added as exception breakpoint. This allows you to inspect the variables for the iteration and conclude which specific attribute is the culprit.
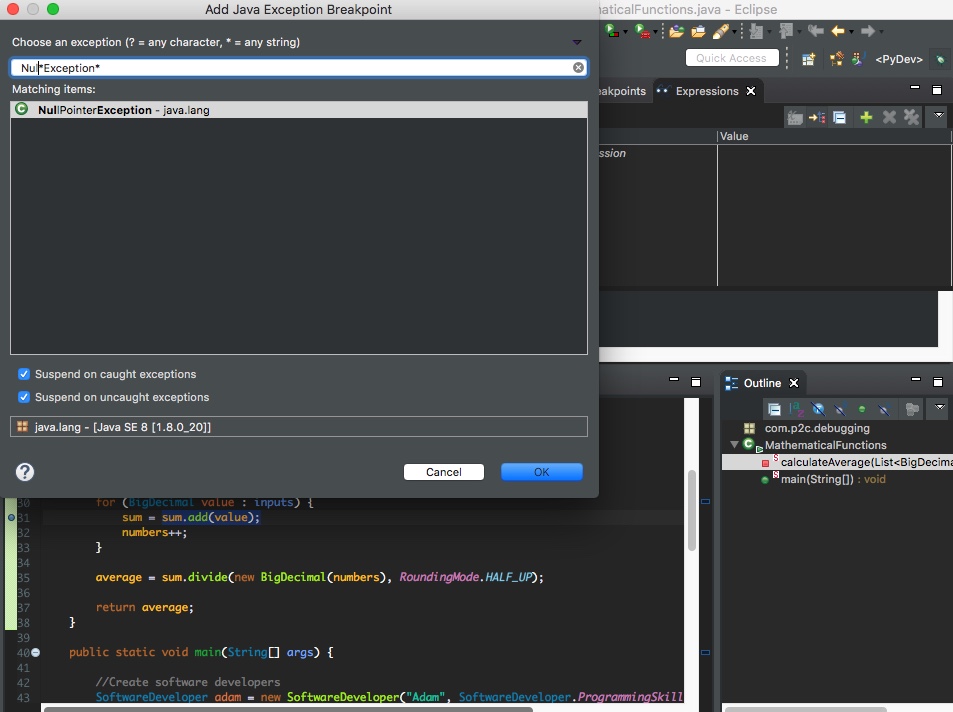
Adding a java exception breakpoint is the easiest one. You just need to name the exception, rest is taken care by the debugger. Please check the screen shots below to find out how you can add an exception breakpoint.
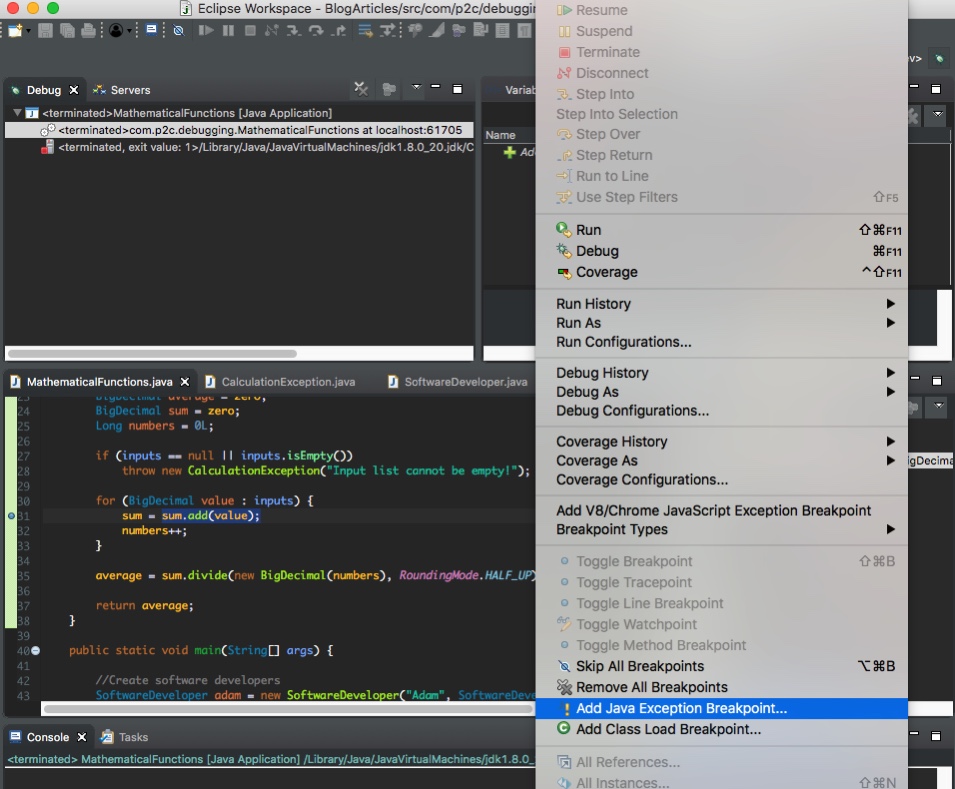
On click of ‘Add Java Exception Breakpoint’ option shown above, a dialog box will appear for selecting the exception break point. We may choose to suspend execution on caught exceptions, uncaught exceptions or both. Multiple exception breakpoints can be added by repeating the process.
Up the Game with Conditional Debug Points
Conditional debug point setting is the most effective debugging technique which is also the most ignored one. This technique is often ignored due to not knowing how powerful it can be.
Let us continue with our previous example of a for loop with 1000 elements. Only difference being, our code is not throwing any exception this time, but producing erroneous result. How can we find out the issue?
Obviously, we don’t want to execute the for loop one item at a time for 1000 times. What is the way out then? Is there any way to trick the debugger to suspend execution just for the item in the list you want?
Conditional debugging is just the feature we need. Conditional breakpoints allow us to write an expression using the variables in scope at the position we are adding the breakpoint. The expression must evaluate to a Boolean type. Debugger evaluates the expression each time runtime hits the line number. But, execution is suspended only if the expression evaluates to true.
Now you must be convinced that conditional breakpoint is a powerful tool. Let me show you how conditional breakpoints are set. Suppose our code for calculating average salary is not working correctly for Java developers. Therefore, instead of inspecting each developer instance in list of developers we want to suspend breakpoint only for Java developers.
Right click on the breakpoint already set at the line where you want to add condition. From the context menu displayed, select ‘Breakpoint Properties’ option as shown below.
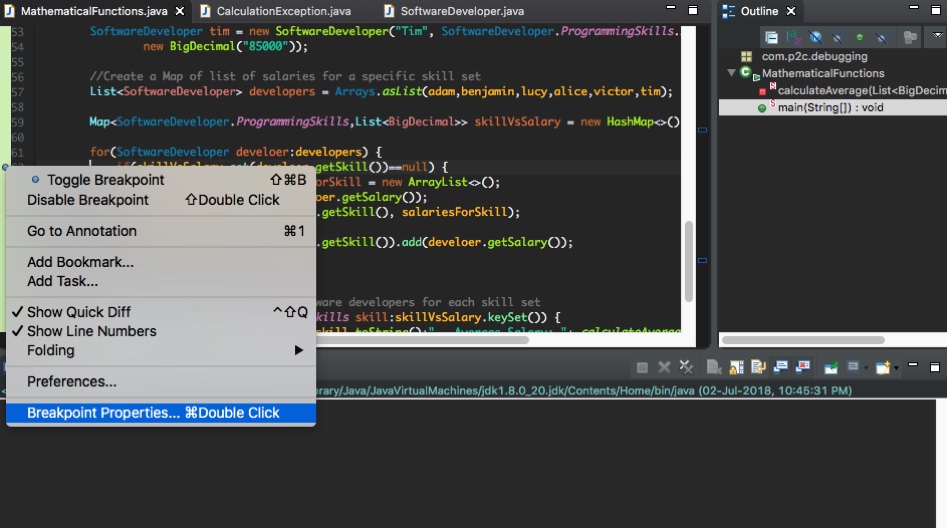
A popup window will appear where we can select different properties of the breakpoint. Check the ‘Conditional’ checkbox and select ‘Suspend when true’ option. After this we need to enter the expression that will be evaluated for the breakpoint. In this case we have compared the skill attribute of developer entity with programming skill Java as we want to suspend the breakpoint only for java developers. Click on apply and close button.
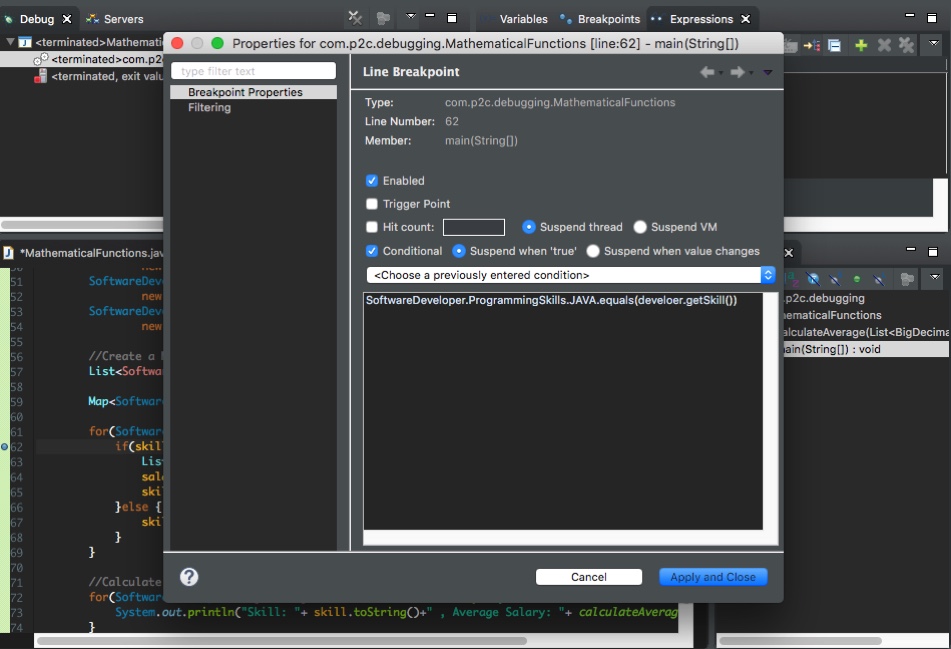
Now if we run the java class in debug mode, execution will be suspended only if skill set of the developer is Java.
That’s all for this article. I am sure the techniques described here will make your life a bit easier. You will spend less time with the debugger and focus on more important aspects of your life. Please provide your valuable feedback in the comment. Also let me know if you want me to cover any specific topic.


